The main object in Online Analytical processing is the cube. A cube is defined as a subset of the data in the data warehouse, organized and summarized into multidimensional structure that consists of dimensions and measures.
Introduction to Cubes
The purpose of creating cubes is to provide an easy to use mechanism for data access and quick and uniform response time for queries. User interface controls are inbuilt into Analysis Services to enable end users to connect to the server for queries and manipulate the cube. Aggregations built into the cube at the time of creation of the cube, enable pre-calculated summary data to be returned to end users uniformly and quickly. The results of a query are then, retrieved from these aggregations, the cube’s source data, a copy of the data on the Analysis Server or on the Client cache or a combination of any of these.
Schemas are a set of joined tables in a data warehouse from which the cube draws its source data. The central table of the schema is the fact table, the source of the cube’s measures. The other tables joined to the fact table are the dimension tables—which are the source of the cube’s dimensions. The tables in a schema can be arranged and linked in the Snowflake schema or the Star schema.
Measures define the cube and the dimensions that are contained in the cube. A measure is a unit of the data that is being analyzed. For instance the sales cube in the FoodMart 2000 database, contain the measure Item_Sale_Price and Item_cost. These measures are used to evaluate data in the dimensions Store_Location, Product_Line and Fiscal_Year.
Cubes contain a hierarchy of Levels. A level is an element of a dimension hierarchy which describe data from the most summarized to the most detailed units the dimension. Levels are arranged in hierarchies which define the relative positions of members in a level to each other. For instance Store_Location dimension includes the level hierarchies: Continent, Country, Region, State_Province, City and Store_number. Each level in a dimension is of a finer granularity than its parent. For instance the level fiscal year contains Year, month, quarter, week and day which are members of the level.
Dimension levels are powerful tools as they help users drill down to granular levels or drillup to summarized levels of data in a cube.
The values within a cube represent the measures. These values exist for all cells in the cube. Packages: 190 and Last: Feb 20-21 may be measures contained in a cell. The Package may refer to the number of packages exported during the month February and on the days 20th and 21st. The cube may incorporate a route dimension which tells the end user the route by which the package was exported and the Max function may aggregate the packages and so on.
End users can determine the measures’ values for each and every member of the dimension because measure values are aggregated by the members. In addition measures can aggregate for all combinations of members from different dimensions. As a result it is possible to evaluate measures by members in multiple dimensions simultaneously.
A cube can contain up to 128 dimensions with large number of members and up to 1024 measures. Usually cubes are made with a very modest number of dimensions and members as against the scope and endless possibilities of the cube.
Cubes can be of various kinds. Regular cubes are cubes based on tables in the databases specified in the data source. They must contain at least one partition. The aggregations of data are stored in the Data folder of the Analysis server in which it is defined or another Analysis server depending on the storage modes and types of cubes partitions defined. Linked Cubes are cubes that are based on another regular cube that is defined and stored on another Analysis Server. Though these cubes appear and function like regular cubes, they can be spread over a number of Analysis servers and are linked together. The cube on which the linked cube is based is called the source cube and the server that stores the linked cube is called the publishing server. The linked cube is stored in the subscribing server. Distributed Partitioned Cubes are regular cubes that employ partitions on multiple Analysis servers. These partitions are stored in multiple Analysis servers other than the Analysis server which stores the meta data for the partition. Virtual cubes are a combination of several cubes into one logical cube. The measures and dimensions are selected from the consolidated set of measures and dimensions in the underlying component cubes. The virtual cube appears as a single cube to end users. Local cubes are cubes that are stored in the local system or the server and end users can browse the cube without connecting to the server if it is on the local machine. These cubes are based on tables and do not contain aggregations or partitions. Real time cubes are regular cubes that employ relational OLAP(ROLAP) partitions or dimensions that support real-time OLAP feature of Microsoft Server 2000 Analysis Services. Real-Time cubes do not require the cube to be processed every time the data changes and cube updates happen even as data changes in the table. Write Enabled Cubes are cubes that enable modification of the cubes data. These cubes enable users to explore scenario changes by changing cell values and analyzing the effects of the changes on the cube data.
Cubes are subordinate to the database in the object hierarchy and the database is the container for related cubes and the objects they share. Data sources, measures, dimensions, Partitions, Cube roles and commands are subordinate to cubes.
Creation of a cube involves three steps: Definition, Aggregation design and Processing. The cube is designed based on the analytical requirements of end users. A fact table is selected and measures within fact tables are identified. Dimensions are then created using one or more columns from another table. We saw how to build cubes using the Cube Wizard in “Introducing Analysis Manager Wizards”. Once the cube is designed the aggregations are to be defined using the Storage Design Wizard. Designing the aggregations specifies the summarization strategy. Finally the cube is processed with the full process option which creates the aggregations.
Once the cube is created, the Cube Editor is used to maintain it. Reprocess of a cube may be required if the source data changes. Cube security issues will have to be addressed using the security options available in Analysis services. We will be dealing with all these issues in greater detail in the sections that follow.
{mospagebreak}
Working with Cubes
Dimensions are meaningful only when they are incorporated into a cube. A cube uses the dimension hierarchies to summarize measures from a fact table. A cube must have at least one dimension and one measure and one fact table in its schema.
The Cube Wizard is useful to quickly put together a cube. We saw how this can be done in the lesson “Introducing Analysis Manager Wizards”. Yet there are many cube properties that cannot be set using the Cube Wizard. The Cube Editor helps the user refine the cube and make the required settings. Let us see how to use the Cube Editor to work with the cube.
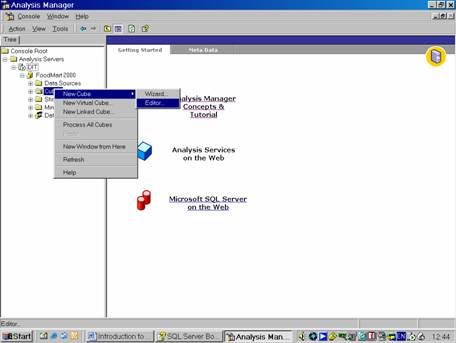
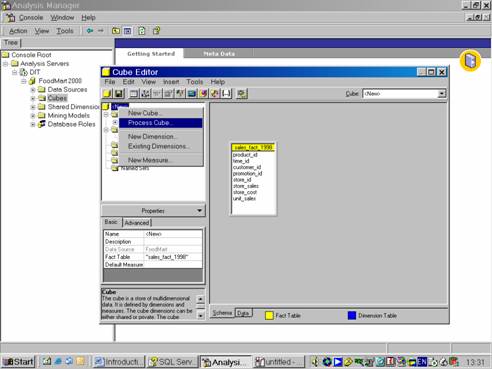
In the Analysis Server, open the database folder and right click the cubes folder and point to New Cube and Click Editor.
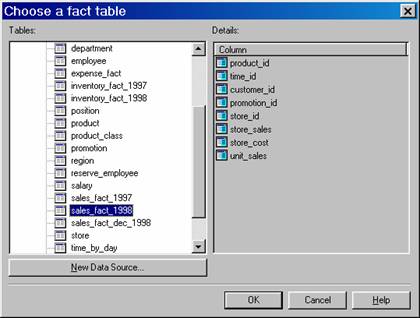
Since each cube requires a fact table, the user is presented with a list of fact tables available in the database
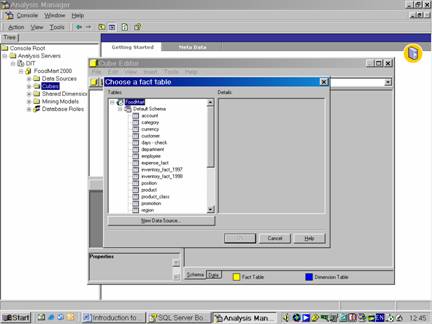
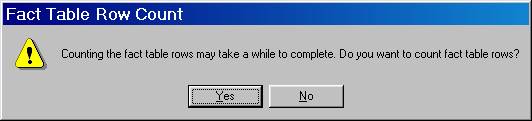
Let us select Sales_Fact_1998. Click OK. Click Yes when cautioned about counting rows in the Fact table
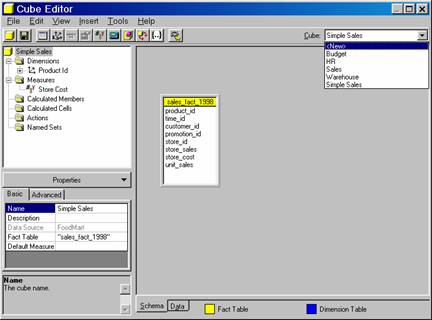
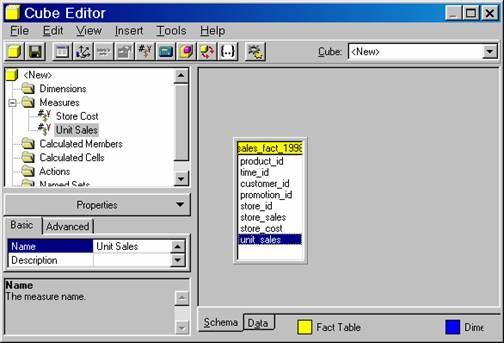
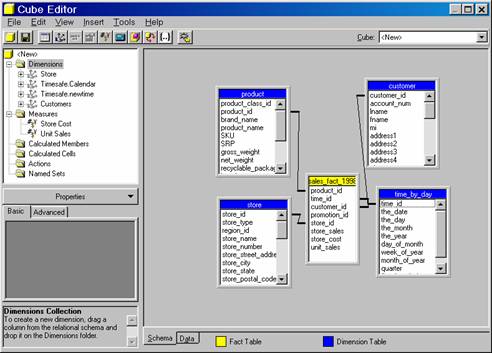
The Cube Editor window appears. The left pane of the Editor contains the cube tree displaying the contents of the cube.
The property pane of the cube is collapsed to a button at the bottom of the left pane. On clicking the button the properties pane opens displaying two tabs called basic and Advanced and a number of properties under each tab.
The right pane displays the schema tab and the data tab.
The schema tab contains the tables that make up the cube and the data tab shows the actual or sample data of the cube.
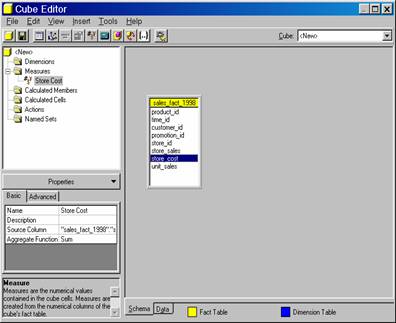
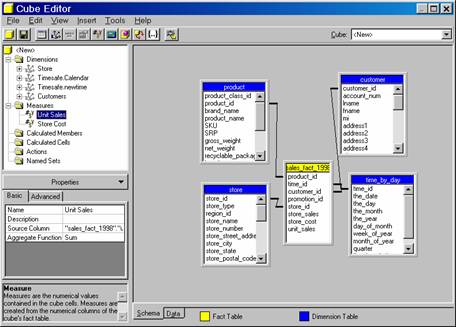
A cube must contain at least one measure from the fact table. Let us drag the store_cost to the Measures folder.
The cube also must contain at least one dimension related to a key column in the fact table. Let us use the key column in the fact table to create a simple private dimension.
Drag the Product_ID from the Sales_Fact_1998 onto the Dimensions folder.
The folder expands to show the new dimension, which is named after the column from the fact table, with any underscore characters converted into space. The icon to the left of the dimension indicates that it is a new private dimension.

Now let us change the All Caption property to All Product. Expand the Product ID dimension, and rename both the dimension and its solitary level from Product ID to Product.
Click on the Data tab to see the sample data for the cube. It looks something like the picture below.
{mospagebreak}
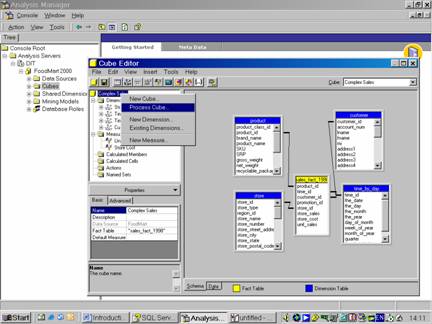
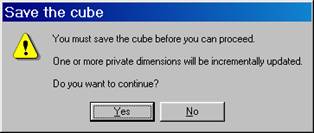
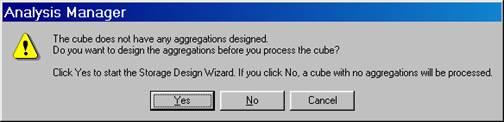
To see actual values the cube must be processed. Click Process cube button and Click Yes to save the cube. Name the cube Sample sales and Click Ok and Click No when prompted to say whether the user needs to design aggregates. Click Ok when asked to choose the processing method. Close the Process Log window.
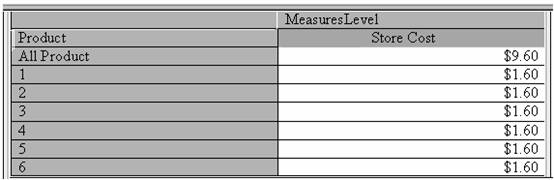
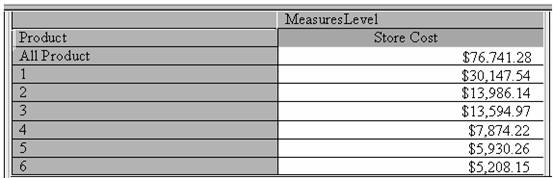
Now click on the data tab to view the data.
A simple cube has been created in the above procedure. The cube has one measure, one private dimension and one level. The values in the preview pane contain the entire contents of the cube.
Now we shall create a cube that uses multiple shared dimensions, measures and levels. Open the Cube Editor and in the Cube Drop down list select <NEW>
Select Sales_Fact_1998 as the fact table.
Click Yes when cautioned about counting the rows in the table.
Drag the store_cost and unit_sales columns from the table to the measures folder.
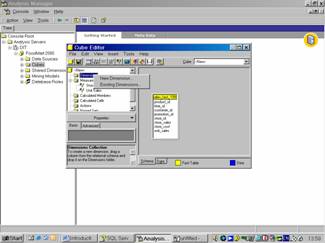
Right click the Dimensions folder, and click Existing Dimensions. Click Add All Dimensions button(>>), and click Ok.
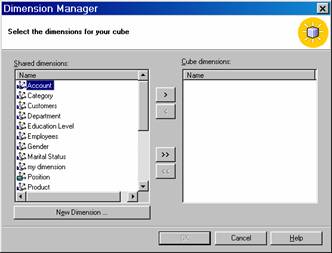
Select the dimension that are to be added to the cube.
The dimensions can be dragged and dropped in the dimension folder to change the order of precedence. For instance if there are two time dimensions one can be dragged above the other to make it the default time dimension. Since in this example we have taken only one time dimension this will not apply.
Measures also can be dragged and dropped in the measures folder to change the order of precedence. Drag the unit sales above store cost to change the order.
Click the Process cube button and click Yes when asked to save the cube. Type Complex Sales as the name of the cube, and click Ok
Click No when asked to design aggregations, click Ok to accept the full process method and close the process log window.


Since the shared dimensions have not been processed, processing the cube will automatically process them.
Click the Data tab and browse the data.
[catlist id=181].