Introduction to Measures
The quantitative and numerical columns from a fact table of a cube are the measures of the cube. When the cube is processed the data in the measures get aggregated across the dimensions of the cube. These measures are of primary interest to the end user and are the central values that get analyzed in a cube.
Every cell in a cube contains a value that is relatable to a measure that has been defined in the Fact table and while processing the cube. Therefore, all queries on a cube will return a measure of the data queried. The value may be retrieved from the cube’s aggregations, its source data, a copy of it on the server or client cache or a combination of these sources depending on the storage settings of the cube.
Measures are aggregated by Microsoft SQL Server 2000 Analysis Services and help in quick retrieval of data on queries. The aggregate functions that are used are Sum, Min, Max, Count and Distinct Count. Common measures used are Sales, cost, expenditure and production count
Analysis Services supports measures based on both additive and non additive columns. Additive columns can be summed. For instance a monetary column is additive. Additive columns are regarded as most suitable measures. However, non additive columns are sometimes used as measures. For instance a numeric identifier like Account Number could be used as a measure. These measures are suitable where the user needs to make a Distinct Count or count as an aggregate function.
Look at the example in the following picture,. It is a simple illustration of how measures are used. Sales_Amount is the measure in the Sales Fact table. The dimension of each of the other tables contain a common element with the fact table:–Product_ID, Customer_ID, Retail_Store_ID. Each cell in the returned dataset would contain a sales value aggregated from the Sales_Amount.
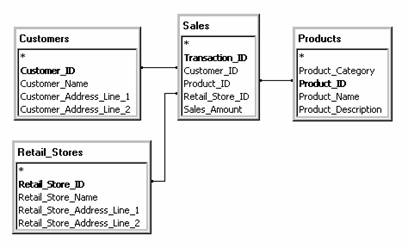
A measure can be derived from multiple columns combined in an expression. The profit measure, for instance, is the difference between two numeric columns–that is:–Sales and Cost.
Calculated members are sometimes used as measures. Calculated members are values created from the formulas. These values are not stored but merely invoked when the cube is browsed.
In the object hierarchy measures are immediately subordinate to the cube. Measures of a cube are created when the cube is created. Measures have to be selected when a regular or a virtual cube is built with the Cube Wizard. Or Cube Editor. After the regular cube is built, the measures are to be maintained in the Cube Editor. A Virtual cube is maintained in the Virtual Cube Editor.
Measures are derived from columns of the fact table and since a regular cube can have only one fact table in its schema, all of the cubes measures have to be contained in it.
Some cubes contain a special type of dimension called the measure dimension. This dimension contains a member for each measure. When end users browse this cube the members in the Measure dimension can be sliced to display values for single measures, or they can place the measure dimension on an axis for viewing values for all the cubes measures.
The measure dimension is distinct from other dimensions in that it is created automatically when the cube is created. It cannot be displayed or edited in the Dimension Editor and can be edited and viewed only in the Cube Editor or the Virtual Cube Editor. It always contains only one level. Custom rules for security can be created for the Measure dimension or the access to the dimension can be restricted by implementing cell security.
While programming with Decision Support Objects(DSO), measures are associated with clsCubeMeasure, clsPartitionMeasure, clsAggregation Measures.
End users will see measures in a tabular form or in a graphical form depending on the kind of client application they are using for browsing the cubes. In both the above presentations of measures, they remain the focal point while the dimensions provide the labels for the rows and columns
In a tabular presentation measures are displayed in rows and columns. The cubes dimensions determine the column and row headings, but measures are the data in the rows and columns except when the user multiplies measures in a cube. In such instances the measures also provide multiple headings to separate the measures.
In graphical presentations, measures display in a variety of ways including lines, shapes, colors, shades and shadows.
{mospagebreak}
Working with Measures
Cubes must contain at least one dimension and one measure. The simplest measures are provided by the fact table of the schema. Additional expressions and measures can be added to a cube. Calculated members can be used as measures. Measures can also be defined as a dimension of the cube. In this section we will be working with measures and study the impact of manipulation of measures on the data in the cube.
Creating a derived Measure
On selecting a measure a source column property appears on the basic tab of the properties pane. This property is similar to the Member Key Column and Member Name Column properties of dimension levels. The property contains the name of the table and a column from the relational data source. The user can enter SQL expressions which are acceptable to the data source.
Let us now decide to pay a commission of 15 percent on total unit sales. We will create a derived measure to calculate this.
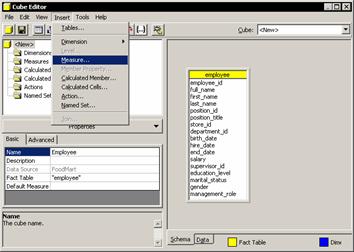
In the Complex Sales cube, right click Measures folder and click New Measure. Select unit sales column and click Ok.
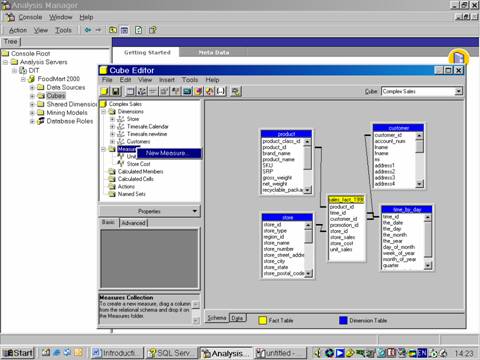
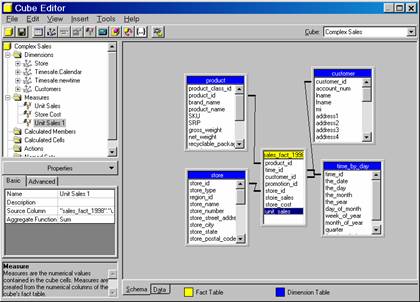
The measure is added with the name unit sales 1.
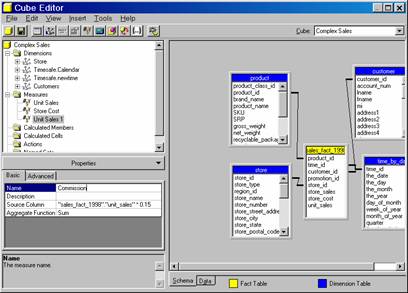
Change the Source Column property to “Sales_fact_1998”.”unit_sales” * 0.15, and type Commission for the name property
On the Tools menu, click Process Cube, agree to save the cube, decline to design aggregates and click OK to specify processing method. Close the process log window and browse the data.
The commission is displayed accurately to the decimal point. Analysis services settings can be used to round off the values to integers by changing the measures Display Format property.
Click the Advanced tab of the Properties pane, type $#,#, (it does not appear in the drop down list) as the Display Format and press Enter. The Preview pane generates a sample values but you can see that the numbers are rounded.
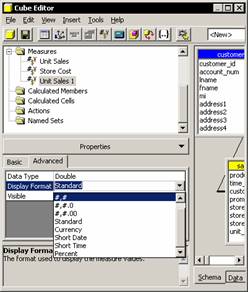
Note that the display format does not change the way the values are stored in the cube. It only changes the way the values are displayed. Also note that the Commission file is stored in the cube as if it were a column of the fact table.
Analysis Services requires that a derived measure is built on the fact table. However if the measure is to reflect across multiple tables then, the user has to create a view in the relational database and use that view in the fact table.
Specifying the aggregation function for a measure
At the most summarized levels the cube browser reflects aggregated values. The default aggregation value is the Sum. This adds the lower level values to get higher level values. However incorrect values can be displayed if a derived measure is used with sum. To get an accurate value a calculated measure has to be created. This is because derived measures calculate as part of the SQL statement that retrieves the values from the fact table. The expression always calculates before any aggregation is performed.
{mospagebreak}
Creating a Calculated Measure
Where a derived measure is calculated before aggregations are created, a calculated measure is created after the aggregations are performed. Derived measures are stored in the fact table. Calculated measures are not stored in the fact table. Accuracy is the only reason why calculated measures are preferred over derived measures. Let us see how calculated measures can be created in the complex sales cube.
In the cube tree, right click the Calculated Members folder, and click New Calculated Member. The Calculated Member Builder Dialog box opens. The first three boxes determine the dimension’s characteristics of the calculated member: Parent Dimension(the dimensions to which it belongs), Parent member(the parent under which it is attached), and the member name.
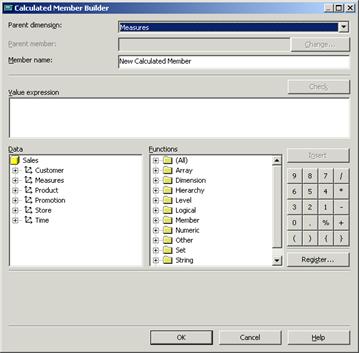
The Parent dimension is set to measures by default. The Parent Member box is disabled because the measure dimension does not support hierarchies. In the Member Name box let us enter Average Price. The lower half of the Calculated Member builder provides all the components necessary for building the calculated member expression. Under Data, expand the measures dimension and then expand MeasuresLevel. The list of measures appears.
In the data tree expand the Measures dimension and double click the store sales measure to make the member name appear in the Value Expression box. Click the (/) on the right side of the dialog box, and then double-click unit sales in the Data tree.
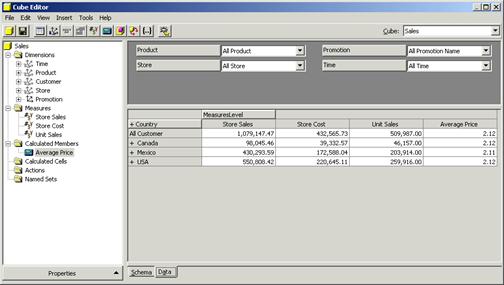
The calculated member gets defined. Click Ok to come back to the cube editor with the average price displayed as a calculated member
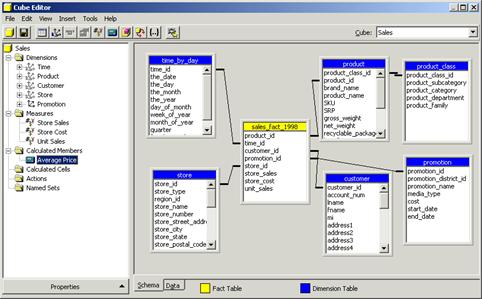
Now save the changes and click the data tab to view the data.
Close the cube editor.
{mospagebreak}
Creating a measure using the count function
The aggregation of a measure is determined by the Aggregate Function property. There are five possible aggregations: Sum, Min, Max, Count and Distinct Count. Any other aggregated value also can be created by using calculated measures. We will examine here how the count function operates. The Sum, Min and Max functions operate only on numeric columns. The Count function operates on non numeric columns also. It does not count the unique occurrences of a key. For this the Distinct Count function is used.
One of the most important uses of the Count function is to allow the creation of a calculated measure that properly calculates an average. The calculated measure is created with the Count function as the basis.
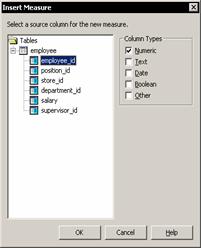
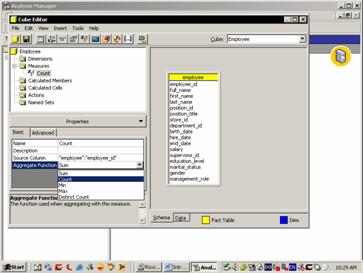
Click the Insert Measure toolbar button, and double click the Employee_Id and type Count for the Name property of the new measure, and change the value of the Aggregate function property to count.
Click the Process cube button and save the cube. Since Count is a regular measure and not a calculated measure it is important to process the cube after adding it.
Say no to designing aggregations and accept the proposed processing method. Close the process log window and scroll the data pane to see the values in the cube.
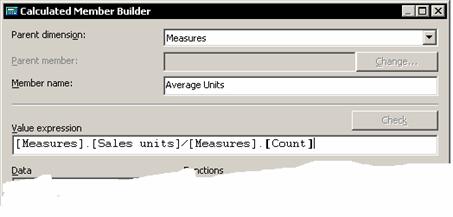
Click the Insert Calculated Member toolbar button. In the Calculated Member builder dialog box type Average Units as the Member name.
Expand the Measures dimension and Double click the sales units measure, click the (/) and double click the Count measure. Then click OK.
Select the Average Units measure in the Calculated members folder, and for its format setting string property, select #,# from the list. Press Enter and scroll to see the values in the Data Pane.
The count function allows the user aggregate the row count from the fact table in parallel with the value that has to be averaged. The calculated member can then be created with the proper weighted average at each level of the hierarchy.
Hiding Internal Measures
A user may want to use a measure an intermediate value for creating a calculated measure, but may need to hide it from client applications. This property of the measure can be hidden by setting the visible property of the measure to false. It disappears from the list of measures and even from the Calculated Member Builder dialog box. Though this measure can still be used in expressions, it will have to be manually typed in.
[catlist id=181].