A hierarchy defines the relative positions of members in a dimension. Hierarchies are sometimes represented as pyramidal structures. The members in this structure are arranged in an expansive order—from the most summarized to the most detailed. For instance in a geography dimension the country may the most summarized and the individual cities and localities may be the most detailed members of the hierarchy.
Analysis Services supports three kinds of hierarchies. Balanced, unbalanced and ragged. A balanced hierarchy is a hierarchy in which all branches descend to the same level and each member’s logical parent is the level immediately above the member. Examples of balanced hierarchies are regular and virtual dimensions. In unbalanced hierarchies, the branches of the hierarchy descend to different levels as in parent child dimensions. Ragged hierarchies are hierarchies in which one members’ logical parent is not in the level immediately above the member. As a result the branches of the hierarchy descend to different levels. Ragged hierarchies are supported in regular and in parent child dimensions. The ragged hierarchy becomes an unbalanced hierarchy in the parent child dimension. The Hide Member If property in the property pane is used to make a hierarchy ragged or the Skipped Levels column property of a level is used to support a ragged structure. These properties are not supported in virtual dimensions.
Analysis services supports dimensions with multiple hierarchies. These provide an alternate view of the cube data. Dimensions with multiple hierarchies can be defined as two or more dimensions having names that share the same prefix followed by a period but having different suffixes. Example:– Time Calendar and Time Fiscal. The only condition to this is that the suffix should not be equal to any current or future level name or member name in the dimension. This rule is imposed to ensure that queries using the dimension do not get ambiguous results. The process of creating hierarchies for a time dimension is illustrated in the section Creating a Time Dimension.
How to create a dimension with multiple hierarchies in Dimension Editor
In the Analysis Manager tree pane, expand the database in which you want to create the dimension with multiple hierarchies.
Right-click the Shared Dimensions folder, point to New Dimension, and then click Editor.
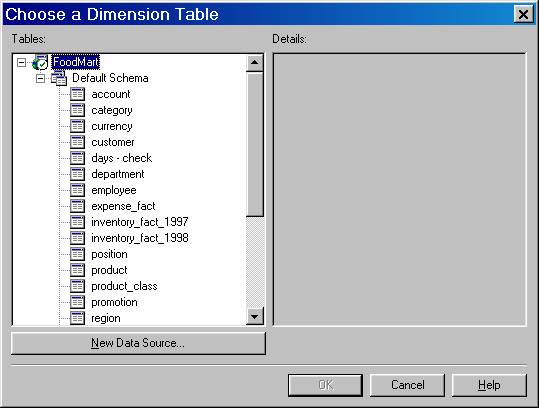
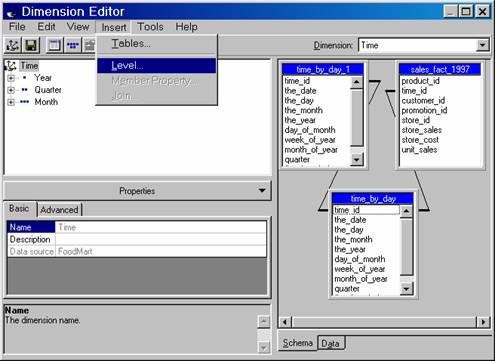
In the Choose a Dimension Table dialog box, expand a data source, click the dimension table for the dimension, and then click OK. Dimension Editor appears with the dimension table showing in the Schema tab.
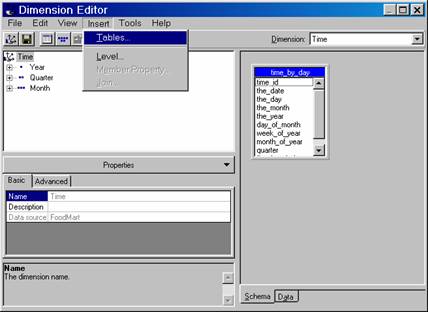
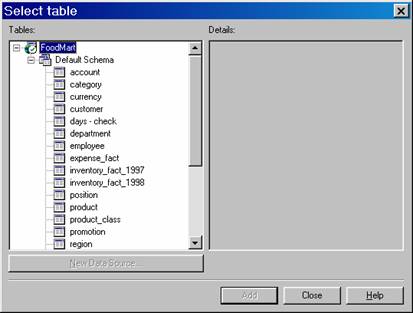
To add more tables to the dimension, on the Insert menu, click Tables, and then use the Select Table dialog box.
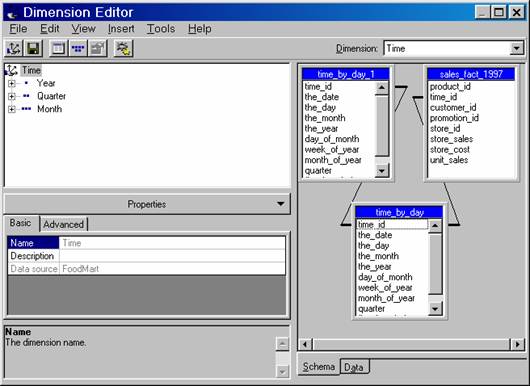
If the dimension contains multiple tables, ensure each is joined to another. To join two columns, in the Schema tab, drag one column to the other.
Create levels in the dimension. It is easiest to create the highest, most general level first and then create progressively lower, more specific levels; otherwise, if member counting is enabled, a confirmation dialog box appears each time you add a level. For each level you want to create:
On the Insert menu, click Level.
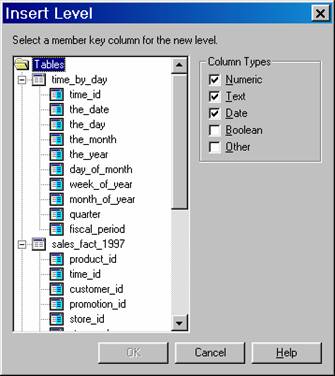
In the Insert Level dialog box, select the column on which the level is based, and then click OK. As you create each level, it appears in the tree pane.
(Optional.) In the properties pane, modify the properties of the dimension and its levels.
To save the dimension, on the File menu, click Save, type a name for the dimension in the New Dimension Name dialog box. To define a hierarchy for the dimension, this name must be of the form dimensionname.hierarchyname, where dimensionname is unique if there are no existing hierarchies or the same as another if it is another hierarchy of a dimension; hierarchyname is unique for each hierarchy being defined. Click OK.
{mospagebreak}
Adding Hierarchies to Existing Dimensions
Hierarchies can be added to a dimension in two ways. If a hierarchy has already been defined for a dimension then the Dimension Editor can be invoked to edit the dimension. If the hierarchy is to be added to a dimension that has no defined hierarchies, then, new hierarchies can be created by renaming the dimension with a new dimension name part, a period and a hierarchy name part. Further hierarchies can be created on similar lines with the hierarchy name being different. It should be noted that when creating dimensions with multiple hierarchies, the hierarchy part of the name should not be equal to any current or future level name or member name in the dimension as queries will derive ambiguous results.
How to add a hierarchy to an existing dimension
In the Analysis Manager tree pane, expand the database in which you want to create the dimension with multiple hierarchies, and then expand the Shared Dimensions folder.
Right-click the shared dimension with an identified hierarchy in which you want to add a hierarchy, and then click Edit. Such dimensions have names where a period is used to separate the dimension name part from the hierarchy name part.
In Dimension Editor, edit the dimension by adding or deleting levels or changing its schema.
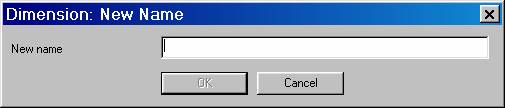
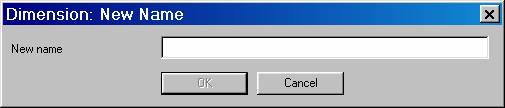
After editing the dimension, to save the dimension with a new hierarchy, on the File menu, click Save As to display the Dimension: New Name dialog box. To add a new hierarchy, change the hierarchy part of the name following the period in the New name box. (Do not change the dimension name part before the period.) Click OK.
Please note that when additional hierarchies are created for dimensions, the hierarchy part of the name should not equal any current or future level name or member name in the dimension because queries using the dimension may be ambiguous.
To add a hierarchy to a dimension without a previously identified hierarchy
In the Analysis Manager tree pane, expand the database in which you want to create the dimension with multiple hierarchies, and then expand the Shared Dimensions folder.
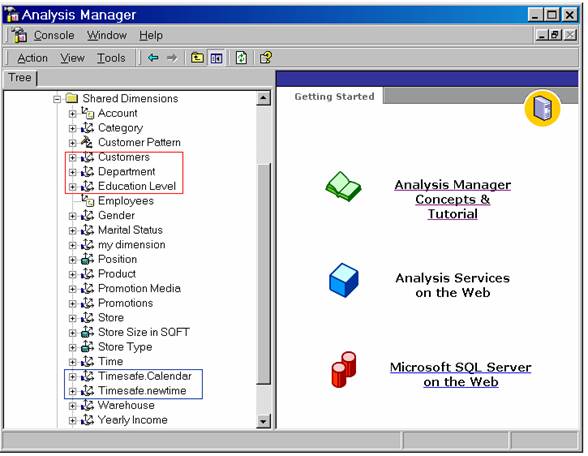
Right-click the shared dimension with an unidentified hierarchy in which you want to add a hierarchy, and then click Edit. The names of dimensions with unidentified hierarchies are those that do not contain periods. The dimensions without periods are marked in red and those with periods are marked in blue in the picture below.
In Dimension Editor, to create a new dimension with a new hierarchy based on the selected dimension, on the File menu, click Save As to display the Dimension: New Name dialog box. In the New name box, provide a different dimension name followed by a period and a hierarchy name. Click OK.
Please Note that when creating dimensions with multiple hierarchies, the hierarchy part of the name should not equal any current or future level name or member name in the dimension because queries using the dimension may be ambiguous.
(Optional.) In Dimension Editor, edit the hierarchy of the dimension by adding or deleting levels or changing its schema.
After editing the dimension and its hierarchy, on the File menu, click Save to save changes.
(Optional.) To create additional hierarchies for the dimension, on the File menu, click Save As to display the Dimension: New Name dialog box. To add a new hierarchy, change the hierarchy part of the name following the period in the New name box. (In this case, do not change the dimension name part before the period.) Click OK.
Repeat Steps 4 through 6 to edit and save the new hierarchy.
[catlist id=181].