VB.NET 2005 Tutorials : Debugging a Windows Application
In this tutorial you will learn how to Debug a Windows Application, Step through Program Execution, Stop Debugging or Stop Execution, Stepping Through Code, Setting BreakPoints, Analyzing Program State to Resolve Errors, Debugging on Errors, Exception Assistant, Debugging a Running Process, Debugging the Code in DLL files and Debugging a Remote Process.
To debug a .NET Framework application, the compiler and runtime environment must be configured to enable a debugger to attach to the application and to produce both symbols and line maps, if possible, for the application and its corresponding Microsoft Intermediate Language (MSIL). Once a managed application is debugged, it can be profiled to boost performance. Profiling evaluates and describes the lines of source code that generate the most frequently executed code, and how much time it takes to execute them.
The .NET Framework applications are easily debugged using Visual Studio, which handles many of the configuration details. If Visual Studio is not installed, you can examine and improve the performance of .NET Framework applications in several alternative ways using the following:
- System.Diagnostics classes.
- Runtime Debugger (Cordbg.exe), which is a command-line debugger..
- Microsoft Common Language Runtime Debugger (DbgCLR.exe), which is a Windows debugger.
The .NET Framework namespace System.Diagnostics includes the Trace and Debug classes for tracing execution flow, and the Process, EventLog, and PerformanceCounter classes for profiling code. The Cordbg.exe command-line debugger can be used to debug managed code from the command-line interpreter. DbgCLR.exe is a debugger with the familiar Windows interface for debugging managed code. It is located in the Microsoft.NET/FrameworkSDK/GuiDebug folder.
Stepping through Program Execution
The Visual Studio debugger provides powerful commands for controlling the execution of the application.
Start Execution
Starting execution is one of the most basic debugging functions.
To start debugging
1. From the Debug menu, choose Start,Step Into, or Step Over.
-or-
2. In a source window, right-click on a line of executable code and choose Run to Cursor from the shortcut menu.
If you choose Start, the application starts up and runs until it reaches a breakpoint. The execution can be broken up at any time to examine values, modify variables, and otherwise examine the state of the program. For
If Step Into or Step Over are chosen, the application starts and executes then breaks on the first line.
If Run to Cursor is selected, the application starts and runs until it reaches a breakpoint or the cursor location, whichever comes first. The cursor location can be set in a source window. In some cases, a break does not occur. This means that execution never reached the code where the cursor is set.
The solution may contain more than one project. In that case, the startup project can be selected for launching using the Debug menu execution commands. Alternately, selected project can be started from Solution Explorer.
The Start can be used without debugging command (on the Debug menu) to start execution of a project without the debugger. Please note that the ability to debug may be limited by whether the code was built with debug information, whether the debugger has access to the source code, and whether the common language runtime JIT compiler is tracking debug information. If the Visual Studio debugger does not find debug information for the program, it usually reports "no matching symbolic information found". In some cases it omits the message and treats a Start command as "Start without debugging". Debug information is generated by default when the debug configuration of your program is built. If the debugger cannot find symbols, a symbol path will be specified. To aid in debugging system calls, install system debug symbols.
One of the most common debugging procedures is stepping — executing code one line at a time.
Stop Debugging or Stop Execution
Stopping debugging means terminating the debugging session. Stopping execution means terminating the process being debugged and ending the debugging session. It should not be confused with breaking execution, which temporarily halts execution of the process being debugged but leaves the debugging session active.
To stop debugging
- From the Debug menu, choose Stop Debugging.
Stop Debugging terminates the process being debugged if the program was launched from Visual Studio. If the process is attached, instead of launching it from Visual Studio, the process continues running. If attached processes are to be terminated, a single process can be terminated from the Processes window or all attached process can be terminated with the Terminate All command.
To terminate all attached processes debugging
- From the Debug menu, choose Terminate All.
If the current run is to be stopped and a new run began, the Restart command has to be used.
To stop debugging and restart
- From the Debug menu, choose Restart.
Restart stops the current debugging session and restarts the startup project.
Debugging will stop automatically if the application being debugged is exited. (If multiple programs are being debugged, the debugging will continue until the last program is exited.) If a project hosted by another application is being debugged, such as a web project hosted by Internet Explorer, debugging stops if the host application is exited(such as Microsoft Internet Explorer).
In Visual Basic and C#, if you are debugging a Web service and the client application that uses that service is terminated, debugging of the Web service stops.
Break Execution
When an application with the Visual Studio debugger is being debugged, the application is either running (executing) or it is in break mode. Most debugger features, such as evaluating expressions in the Watch window, are available only in break mode.
The debugger breaks execution of the program when execution reaches a breakpoint or when an exception occurs. The execution can be broken manually at any time. If the break is set while executing code without corresponding source, the user will be able to debug in the Disassembly window.
To break execution of your program manually
- From the Debug menu, choose Break All.
The debugger stops execution of all programs running under the debugger. The programs do not exit and execution can be resumed at any time. The debugger and your application are now in break mode.
If multiple programs are being debugged, a breakpoint or Break All command affects all programs being debugged by default. This can be changed by default if only the current program is to be broken.
Stepping Through Code
The Debug menu provides three commands for stepping through code:
- Step Into
- Step Over
- Step Out
Step Into and Step Over differ in only one respect — the way they handle function calls. Either command instructs the debugger to execute the next line of code. If the line contains a function call, Step Into executes only the call itself, then halts at the first line of code inside the function. Step Over executes the entire function, then, halts at the first line outside the function. Use Step Into if you want to look inside the function call. Use Step Over if stepping into functions are to be avoided.
On a nested function call, Step Into steps into the most deeply nested function. If Step Into is to be used on a call like Func1(Func2()), the debugger steps into the function Func2.
In native code, if a specific nested function is to be stepped into, use the Step Into Specific command from the shortcut menu. (If managed code is being debugged, this command is disabled.)
Use Step Out inside a function call and return to the calling function. Step Out resumes execution of the code until the function returns, then breaks at the return point in the calling function.
Setting BreakPoints
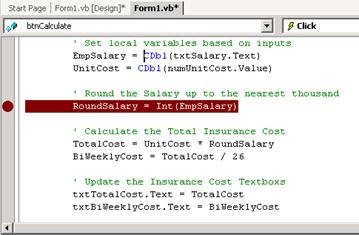
Breakpoints are still a great way to stop the execution of the program at predefined points in the code. Applying the breakpoints is an easy task. Simply open a section of code and click on the far left of the design window in the gray area, as in the example below.
Right-click over the breakpoint indicator to display a menu of additional options.
Outlining is a tool for organizing code into a more readable format. Highlight a portion of code, then right-click and select the Outlining submenu. Hide Selection will collapse the marked selection of code and put an indicator (+ . . .) to be used to expand it again as needed. Also the hidden code can be quickly viewed without expanding by simply performing a mouse-over of the collapsed code indicator.
The Breakpoints window is a practical dialog that will display all of the marked breakpoints and certain settings associated with each. To open this window, select the Debug menu, Windows then Breakpoints, or press CTRL+ALT+B. The window contains a toolbar and a list of breakpoints:
{mospagebreak}
.
.
.
Analyzing Program State to Resolve Errors
The Visual Studio debugger is a powerful tool that allows users observe the state of the program and locate logic errors. The debugger works with all Visual Studio programming languages and their associated libraries. With the debugger, execution of the program can be suspended to examine the code, evaluate and edit variables in the program, view registers, see the instructions created from the source code, and view the memory space used by the application. With Edit and Continue, changes can be made to the code while debugging and continue execution.
The Visual Studio debugger provides a Debug menu for access to debugger tools. Debugger windows and dialog boxes display information about the program and allows the user enter additional information. Help can be obtained on any window or dialog box by pressing F1.
Debugging on Exceptions
An exception is an abnormal situation that happens while a program is running. Exceptions are often indications of problems that have to be debugged. When an exception occurs, the debugger writes an exception message to the Output window (unless disabled in the Options dialog box).
The debugger may or may not break execution when exception occurs.
-
If an exception occurs and is not handled, the debugger always breaks execution.
-
The debugger can be told to break execution immediately when an exception is thrown (before any handler is invoked).
-
If the user is debugging with Just Mode Code, a third option is also available. The debugger can be told to break on any exception that is not handled by a handler in user code ("My Code").
Remember, if an exception occurs and is not handled at all, the debugger always break. The user-unhandled setting does not change that.
The Visual Studio debugger recognizes the following categories of exceptions:
-
C++ Exceptions
-
Common Language Runtime Exceptions
-
Managed Debugging Assistants
-
Native Run-time Checks
-
Win32 Exceptions
Most exceptions have handlers, which are designed to respond to an exception when it occurs, giving the program a chance to recover from the abnormal situation. Native Run-time Checks do not have handlers.
In a Visual Basic application, the debugger represents all errors as exceptions, even if you use On Error–style error handlers.
For Visual Basic, C#, and J#, the debugger now features a new Exception Assistant that provides more information when an exception occurs.
Please note (Visual Basic and Visual C# only) If an uncaught exception occurs with the Exception Assistant turned off, a pseudovariable $exception is added to the Locals window. This pseudovariable can be expanded to see information on the exception.
Exception Assistant
The Exception Assistant is a new feature for debugging Visual Basic, C#, and J# applications. The Exception Assistant takes the place of the Exceptions dialog box that appears when an exception occurs in other languages, such as C/C++. The Exception Assistant provides more information on an exception than the Exceptions dialog box, making it easier for you to locate the cause of the exception and fix the problem.
The Exception Assistant, which appears whenever a run-time exception occurs in the debugger, shows the type of exception, troubleshooting tips, and corrective actions that may be applied through the Exception Assistant.
An exception is an object that inherits from the System.Exception class. An exception is thrown by code whenever a problem occurs; it is passed up the stack until the application handles it or the program fails.
Please note:– The options available in dialog boxes, and the names and locations of menu commands, might differ from what is described in Help depending on the active settings or edition. This Help page was written with General Development Settings in mind. To change the settings, choose Import and Export Settings on the Tools menu.
The following table lists the actions that may appear in the Exception Assistant Actions pane:
|
Action |
Description |
|
Find out more about the exception |
Displays the exception object’s properties. |
|
Add permission. |
Adds necessary security permissions. |
To apply an action from the Exception Assistant Actions pane
-
Click the action you wish to perform.
Debugging a Running Process
The Processes window shows all processes that have been attached to or launched from Visual Studio.
In the Processes window, the user can choose any attached process and make it the current process for debugging. The user can also:
-
Terminate a process
-
Detach a process
-
Break a process
-
Continue a process
The Processes window is found in Visual C++ Express Edition and Visual Studio Professional, Enterprise, and Enterprise Architect Editions only. The default integrated development environment (IDE) settings chosen when Visual Studio is set up, may hide the menu command that displays this window. In that case, the user must add the command back to the Debug menu before this feature can be used.
The Visual Studio debugger has the ability to attach to a process that is running outside of Visual Studio. The attach capability can do the following:
- Debug an application that was not created in Visual Studio.
- Debug multiple processes simultaneously. (You can also debug multiple processes by starting multiple projects within a single solution.)
- Debug a process running on a remote machine.
- Debug a DLL that runs in a separate process that cannot easily be started from Visual Studio (for example, a service or an ISAPI DLL running with Internet Information Services).
- Start the debugger automatically when a process crashes while running outside of Visual Studio (Just-In-Time debugging).
Once a program has been attached, the user can use debugger execution commands, inspect the program state, and so on. The ability to inspect the program may be limited, of course, depending on whether the program was built with debug information and whether the user has access to the program’s source code, and whether the common language runtime JIT compiler is tracking debug information.
The Visual Studio debugger can be attached to any running process.
{mospagebreak}
.
.
.
To attach to a running process
1. From the Debug menu, choose Attach to Process. (If no project is open, choose Attach to Process from the Tools menu.)
2. In the Attach to Process dialog box, find the program you want to attach to from the Available Processes list. If the program you want to debug is running on another machine, you must first select the remote machine
3. Click the Attach button.
The Available processes list is displayed automatically when you open the Processes dialog box. Processes can start and stop in the background while the dialog box is open, however, so the contents may not always be current. You can refresh the list at any time to see the current list of processes.
You can be attached to multiple programs when you are debugging, but only one program is active in the debugger at any given time. You can set the active program in the Debug Location toolbar.
All Debug menu execution commands affect the active program. You can break any debugged program from the Processes dialog box.
Deal With Attach Errors
When the Visual Studio debugger attaches to a running process, the process can contain one or more types of code. The code types the debugger can attach to are native, managed, T-SQL, and script. These code types are displayed and selected in the Attach to Process dialog box.
Please Note: For the debugger to attach to code written in Managed C++, the code needs to emit DebuggableAttribute. This can be added to the code automatically by linking with the /ASSEMBLYDEBUG linker option.
Sometimes, the debugger can successfully attach to one code type, but not to another code type. This might happen if the users are trying to attach to a process running on a remote machine. The remote machine may have remote debugging components installed for some code types but not for others. It can also happen if the user tries to attach to two or more processes for direct database debugging. (SQL debugging supports attaching to a single process only.)
If the debugger is able to attach to some, but not all, code types, the user will see a message box with a message similar to this:
The requested attach was not completed successfully.
Program types successfully attached are:
- Common Language Runtime
- Native (Win32)
- Microsoft T_SQL
Program types that failed to attach are:
- Script
If the debugger successfully attaches to at least one code type, you can proceed to debug the process. The user will be able to debug only the code types that were successfully attached. The example message above shows that the script code type failed to attach. Therefore, the user would not be able to debug script code within the process. The script code in the process would still run, but the user would not be able to set breakpoints, view data, or perform other debugging operations in the Script.
If more specific information is required about why the debugger failed to attach to a code type, the user can try reattaching to only that code type.
To obtain specific information about why a code type failed to attach
1. Detach from the process.
- From the Debug menu, choose Detach All.
2. Reattach to the process, selecting only a single program type.
1. In the Attach to Process dialog box, select the process in the Available Processes list.
2. Click the Select button.
3. In the Select Code Type dialog box, select Debug these code types and the the code type that failed to attach. Clear any other code.
4. Click OK. The Select Code Type dialog box closes.
5. In the Attach to Process dialog box, click Attach.
This time, the attach will fail completely, and a message box will be displayed with a specific error message.
Debugging a Remote Process
Applies to Native Only.
COM applications perform a number of tasks outside of the programmer’s direct control. Communication between DLLs, usage counts on objects, and Clipboard operations are just a few of the areas where the user might encounter unexpected behavior. When this happens, the first step is to track down the source of the problem.
A COM server and container can be debugged using two projects within the same solution. Set appropriate breakpoints in each project and debug. When the container makes a call into the server that hits a breakpoint, the container will wait until the server code returns (that is, until you finish debugging it). Calls can be traced that go across process boundaries.
Debugging a COM container is similar to debugging a standard program. One difference is when event is debugged it generates a callback (such as dragging data over the container application). In this case, breakpoint must be set in the callback function.
The Visual Studio debugger supports stepping across and into containers and servers. This includes the ability to step across remote procedure calls (RPC).
A remote procedure call (RPC) can be used to debug COM client/server applications. RPC must be enabled for debugging to use it. With RPC debugging enabled, when the user steps into the server call from the client, the debugger attaches to the server and lets its code be debugged. Once the debugger is attached, all debugger features can be used with both the client and server processes.
To enable RPC debugging
1. From the Tools menu, click Options.
2. In the Options dialog box, click the Debugging folder.
3. Click the Native page.
4. Select the RPC debugging check box.
Note To debug RPC calls, you must have Administrator or Power User privileges.
Debugging the Code in DLL files
Native Only
When you debug a DLL, you can start debugging from:
- The project used to create the executable that calls the DLL.
– or – - The project used to create the DLL itself.
If the project used to create the executable is available, it is useful to start debugging from that project. A source file can be opened for the DLL and breakpoints in that file can be set, even though it is not a part of the project used to create the executable. If debugging is started from the project that creates the DLL, the user must specify the executable that must be used in debugging the DLL.
To specify an executable for the debug session
1. In Solution Explorer, select the project that creates the DLL.
2. From the View menu, chooseProperty Pages.
3. In the Property Pages dialog box, open the Configuration Properties folder and select the Debugging category.
4. In the Command box, specify the path name for the container. For example, C:Program FilesMyApplicationMYAPP.EXE.
5. In the Command Arguments box, specify any necessary arguments for the executable.
If the executable is not specified in the ProjectProperty Pages dialog box, the Executable for Debugging Session Dialog Box appears when debugging starts.
In this lesson we have examined the process of using the testing and debugging tools for a Windows application. In the last lesson of this series we will be studying how to deploy a Windows based application.
[catlist id=175].