Since the time Oracle 11g has been released way back in the year 2003, it has waved a new exploring instinct among the database users. Till now, I observe the professionals engaged trying their hands out with Oracle 11g new features.
Secure Files, Compound triggers, Result caching, virtual columns, invisible indexes and a lot more to mention have already made their stiff entry into application development and database upgrades. There are several other features which were overseen due to the mass reception of above features. So, let us widen the bag to watch out for some more exciting new features in Oracle 11g version but less talked about.
In the tutorial, I shall highlight two important features which had been the part of Oracle 11g release but less discussed. These features are PL/Scope and PLSQL Hierarchical Profiler. While PL/Scope deals with administrative activity on a program, the hierarchical profiler paves the way to identify the performance hit stages in a program.
PL/Scope: The Identifier Repository
PL/Scope is a compiler driven tool which tracks all the identifiers appearing in a PL/SQL source code. It captures the identifier information like its name, type, and usage in the PL/SQL program and stores it in the SYSAUX tablespace. Note that it can scan the identifiers in an unwrapped program only, but not in the wrapped PL/SQL code.
The PL/Scope feature can be enabled by setting the compilation parameter PLSCOPE_SETTINGS, which is disabled by default. The parameter value has to be set as IDENTIFIERS:ALL to allow the PL/Scope to record the identifier information. The compilation parameter PLSCOPE_SETTINGS can be set at database, session or object level.
When the parameter is set at system level, the identifier logging is available for all the programs created by all users and also in all sessions. For session level setting, the PL/Scope feature is activated only for the current session. If a PL/SQL program is compiled with PL/Scope enabled, the identifier information would be stored only for the specific program.
The identifier information is stored in data dictionary views [DBA | ALL | USER]_IDENTIFIERS. While a DBA can use all three flavors of identifier views, a user can access only USER_ IDENTIFIERS and ALL_ IDENTIFIERS.
Example Syntax [1]
At System or Session level: A DBA sets the compilation parameter at system and session level while a user can set the parameter at session level.
ALTER [SYSTEM | SESSION]
SET PLSCOPE_SETTINGS = ['IDENTIFIERS:ALL' | 'IDENTIFIERS:NONE']
Note that IDENTIFIERS:NONE is the default value for the parameter. It denotes the disabled status of the feature.
At object compilation level: The user can compile a program with different mode of PLSCOPE_SETTINGS.
ALTER [PROGRAM NAME] COMPILE
PLSCOPE_SETTINGS = ['IDENTIFIERS:ALL' | 'IDENTIFIERS:NONE']
The object level setting of PLSCOPE_SETTINGS can be queried from USER_PLSQL_OBJECT_SETTINGS dictionary view. The structure of the USER_PLSQL_OBJECT_SETTINGS is as below. Note the other compilation parameters of similar nature.
SQL> DESC USER_PLSQL_OBJECT_SETTINGS
Name                                      NULL?    TYPE
----------------------------------------- -------- -----------------
NAME                                      NOT NULL VARCHAR2(30)
TYPE                                               VARCHAR2(12)
PLSQL_OPTIMIZE_LEVEL                               NUMBER
PLSQL_CODE_TYPE                                    VARCHAR2(4000)
PLSQL_DEBUG                                        VARCHAR2(4000)
PLSQL_WARNINGS                                     VARCHAR2(4000)
NLS_LENGTH_SEMANTICS                               VARCHAR2(4000)
PLSQL_CCFLAGS                                      VARCHAR2(4000)
PLSCOPE_SETTINGS                                   VARCHAR2(4000)
Illustration
Let us examine a scenario where I shall create a PL/SQL function and generate a report of the identifiers used by the program.
As a pre requisite for demonstration, the DBA has enabled the PL/Scope feature at session level.
ALTER SESSION SET PLSCOPE_SETTINGS = 'IDENTIFIERS:ALL'
/
SESSION altered.
Now, user SCOTT connects and creates a function F_CALCULATE_COMM which calculates new salary of a given employee by adding commission earned to his salary.
CREATE OR REPLACE FUNCTION F_CALCULATE_COMM (P_EMPNO NUMBER)
RETURN NUMBER
IS
CURSOR CUR_EMP IS
    SELECT SAL, COMM
    FROM EMPLOYEES
    WHERE EMPNO=P_EMPNO;
L_COMM NUMBER;
L_SAL NUMBER;
L_NEW_SAL NUMBER;
BEGIN
   OPEN CUR_EMP;
   FETCH CUR_EMP INTO L_SAL, L_COMM;
   CLOSE CUR_EMP;
L_NEW_SAL := L_SAL + L_COMM;
RETURN L_NEW_SAL;
END;
FUNCTION created.
The function has been compiled and created. The dictionary view USER_IDENTIFIERS stores the complete information about the identifiers used in the function. The information includes the identifier type, its name and usage.
SQL> SELECT NAME, TYPE, OBJECT_NAME, USAGE
     FROM USER_IDENTIFIERS WHERE OBJECT_NAME='F_CALCULATE_COMM'
/

NAME                 TYPE               OBJECT_NAME          USAGE
-------------------- ------------------ -------------------- -----------
L_NEW_SAL            VARIABLE           F_CALCULATE_COMM     REFERENCE
L_COMM               VARIABLE           F_CALCULATE_COMM     REFERENCE
L_SAL                VARIABLE           F_CALCULATE_COMM     REFERENCE
L_NEW_SAL            VARIABLE           F_CALCULATE_COMM     ASSIGNMENT
CUR_EMP              CURSOR             F_CALCULATE_COMM     CALL
L_COMM               VARIABLE           F_CALCULATE_COMM     ASSIGNMENT
L_SAL                VARIABLE           F_CALCULATE_COMM     ASSIGNMENT
CUR_EMP              CURSOR             F_CALCULATE_COMM     CALL
CUR_EMP              CURSOR             F_CALCULATE_COMM     CALL
NUMBER               NUMBER DATATYPE    F_CALCULATE_COMM     REFERENCE
L_NEW_SAL            VARIABLE           F_CALCULATE_COMM     DECLARATION
NUMBER               NUMBER DATATYPE    F_CALCULATE_COMM     REFERENCE
L_SAL                VARIABLE           F_CALCULATE_COMM     DECLARATION
NUMBER               NUMBER DATATYPE    F_CALCULATE_COMM     REFERENCE
L_COMM               VARIABLE           F_CALCULATE_COMM     DECLARATION
P_EMPNO              FORMAL IN          F_CALCULATE_COMM     REFERENCE
CUR_EMP              CURSOR             F_CALCULATE_COMM     DECLARATION
NUMBER               NUMBER DATATYPE    F_CALCULATE_COMM     REFERENCE
NUMBER               NUMBER DATATYPE    F_CALCULATE_COMM     REFERENCE
P_EMPNO              FORMAL IN          F_CALCULATE_COMM     DECLARATION
F_CALCULATE_COMM     FUNCTION           F_CALCULATE_COMM     DEFINITION
F_CALCULATE_COMM     FUNCTION           F_CALCULATE_COMM     DECLARATION

22 ROWS selected.
Now, I shall generate the above output in a report format.
WITH v AS
(SELECT    Line,
            Col,
            INITCAP(NAME) Name,
            LOWER(TYPE)   TYPE,
            LOWER(USAGE)  Usage,
            USAGE_ID, USAGE_CONTEXT_ID
  FROM USER_IDENTIFIERS
  WHERE Object_Name = 'F_CALCULATE_COMM'
    AND Object_Type = 'FUNCTION'  )
    SELECT LINE, RPAD(LPAD(' ', 2*(Level-1)) ||Name, 20, '.')||' '||
                 RPAD(TYPE, 20)|| RPAD(Usage, 20)
                 IDENTIFIER_USAGE_CONTEXTS
    FROM v
    START WITH USAGE_CONTEXT_ID = 0
    CONNECT BY PRIOR USAGE_ID = USAGE_CONTEXT_ID
    ORDER SIBLINGS BY Line, Col
/

      LINE IDENTIFIER_USAGE_CONTEXTS
---------- -------------------------------------------------------------
         1 F_Calculate_Comm.... FUNCTION            declaration
         1   F_Calculate_Comm.. FUNCTION            definition
         1     P_Empno......... formal IN           declaration
         1       NUMBER........ NUMBER datatype     reference
         2     NUMBER.......... NUMBER datatype     reference
         4     Cur_Emp......... cursor              declaration
         7       P_Empno....... formal IN           reference
         9     L_Comm.......... variable            declaration
         9       NUMBER........ NUMBER datatype     reference
        10     L_Sal........... variable            declaration
        10       NUMBER........ NUMBER datatype     reference
        11     L_New_Sal....... variable            declaration
        11       NUMBER........ NUMBER datatype     reference
        14     Cur_Emp......... cursor              CALL
        15     Cur_Emp......... cursor              CALL
        15       L_Sal......... variable            assignment
        15       L_Comm........ variable            assignment
        16     Cur_Emp......... cursor              CALL
        18     L_New_Sal....... variable            assignment
        18       L_Sal......... variable            reference
        18       L_Comm........ variable            reference
        20     L_New_Sal....... variable            reference

22 ROWS selected.
The object level compilation parameter settings can be queried from USER_PLSQL_OBJECT_SETTINGS view.
SQL> SELECT PLSCOPE_SETTINGS
FROM USER_PLSQL_OBJECT_SETTINGS
WHERE NAME = 'F_CALCULATE_COMM';

PLSCOPE_SETTINGS
-------------------------
IDENTIFIERS:ALL
The function can be re compiled with modified compilation settings. Note that the modified compilation parameters effect compilation of the current object only. The object level setting is preferable over the session or system level setting of PLSCOPE_SETTINGS.
Every time a program is compiled in Oracle without any compilation parameter, the server inherits the current session level compilation settings. If session level is not available, it searches for database level settings.
The ALTER FUNCTION statement below compiles the function F_CALCULATE_COMM with modified PLSCOPE_SETTINGS mode.
SQL> ALTER FUNCTION F_CALCULATE_COMM
COMPILE PLSCOPE_SETTINGS='IDENTIFIERS:NONE';
Function altered.
Querying the USER_PLSQL_OBJECT_SETTINGS again to check the value of PLSCOPE_SETTINGS for F_CALCULATE_COMM
SQL> SELECT PLSCOPE_SETTINGS
FROM USER_PLSQL_OBJECT_SETTINGS
WHERE NAME = 'F_CALCULATE_COMM';

PLSCOPE_SETTINGS
-------------------------
IDENTIFIERS:NONE
PL/SQL Hierarchical Profiler: Build up the Execution Profile
Profiling is a method employed by the developers to analyze the performance of a blog. The profiler report shows the time taken at each stage in the program. In earlier releases of Oracle, DBMS_PROFILER served the purpose well until the need of dynamic execution program profiler was required.
Oracle 11g R1 introduced the PL/SQL hierarchical profiler to generate dynamic execution program profile. The new profiler can transparently distinguish between the time taken by SQL engine and PL/SQL engine separately. In addition, the hierarchical profiler can analyze the profiled data and generate several reports of different viewpoints. Report generation in HTML format was brought in action and more importantly, the profiled data storage within the database was also introduced. The profiled data would no more be the property of OS file system only, but can be retained in the database itself. This can be of great help while comparing the profiles of same program in different versions or schemas.
The DBMS_HPROF package
Oracle 11g also unpacks DBMS_HPROF utility package to handle all the features associated with the hierarchical profiling.
The PL/SQL hierarchical profiler consists of two subcomponents
- Raw Data Collector – This component simply scans the program and prepares the execution profile in raw format. The profile is stored in an OS level text file.
- Analyzer – The raw profiler data, once analyzed appears in readable format. The component loads the raw profiler data into database tables. The profiler uses the table data to prepare various types of reports.
The description of the DBMS_HPROF subprograms is as below.
|
Subprogram |
Description |
|
ANALYZE Function |
Analyzes the raw profiler output and produces hierarchical profiler information in database tables |
|
START_PROFILING Procedure |
Starts hierarchical profiler data collection in the user’s session |
|
STOP_PROFILING Procedure |
Stops profiler data collection in the user’s session |
The SYS user owns the DBMS_HPROF package. The SYSDBA must grant EXECUTE privilege on the package to the users seeking its services.
SYSDBA> GRANT EXECUTE ON DBMS_HPROF TO SCOTT;
GRANT succeeded.
The profiler tables are not created by default. The DBA must execute the script dbmshptab.sql from ORACLE_HOMERDBMSADMIN folder to create the tables and sequences. The script creates three tables dbmshp_function_info, dbmshp_parent_child_info, and dbmshp_runs.
The tables serve the below purposes
• DBMSHP_RUNS – Maintains flat information about each command executed during profiling.
• DBMSHP_FUNCTION_INFO – Contains information about the profiled function.
• DBMSHP_PARENT_CHILD_INFO – Contains parent child profiler information
The DBA must grant SELECT privilege on the above tables to the concerned user. In addition, the DBA must have a valid directory (here PROFILER_REP) pointing to a valid OS location on a workstation in the server network.
Now, we shall try to profile out last function i.e. F_CALCULATE_COMM.
DECLARE
   L_NEW_SAL NUMBER;
BEGIN
   DBMS_HPROF.START_PROFILING ('PROFILER_REP', 'F_CALCULATE_COMM.TXT');
   FOR I IN (SELECT EMPNO FROM EMPLOYEES)
   LOOP
      L_NEW_SAL := F_CALCULATE_COMM (I.EMPNO);
      DBMS_OUTPUT.PUT_LINE(I.EMPNO||':'||L_NEW_SAL);
   END LOOP;
   DBMS_HPROF.STOP_PROFILING;
END;
/
PL/SQL PROCEDURE successfully completed.
Now, a profiler text file is generated at the directory location PROFILER_REP. The raw profiler data looks as below
P#V PLSHPROF Internal Version 1.0
P#! PL/SQL Timer Started
P#C SQL."".""."__sql_fetch_line5" #5
P#X 812
P#R
P#C PLSQL."SCOTT"."F_CALCULATE_COMM"::8."F_CALCULATE_COMM" #fac892c7867b54c6 #1
P#X 3
P#C PLSQL."SCOTT"."F_CALCULATE_COMM"::8."F_CALCULATE_COMM.CUR_EMP" #980980e97e42f8ec #4
P#X 12
P#C SQL."SCOTT"."F_CALCULATE_COMM"::8."__static_sql_exec_line5" #5
P#X 14944
...
The above profiler data is raw and difficult to understand but still some idea can be drawn out from it with the help of below guidelines and conventions.
P#! Denotes START, STOP or any other comment of the profiler
P#V shares the PLSHPROF banner with version number
P#C implies a call to a subprogram (call event)
P#R implies the return from a subprogram (return event)
P#X shows the elapsed time between preceding and following events
For demonstration purpose, I shall randomly pick up some lines from above raw profiler output, try to interpret them and frame them in a statement.
P#C SQL."".""."__sql_fetch_line5" #5
P#X 812
P#R
The above three lines from the profiler means that an SQL has been invoked at line 5. It took 812 microseconds for execution and then returned back.
Till now, we saw the efficiency of Raw Collector Component of Hierarchical profiler. Now, we shall see how Analyzer component of hierarchical profiler makes it different from other profiler tools.
Connect as SYSDBA and execute the PL/SQL block below to analyze the raw profiler data from a text file
Conn / AS SYSDBA
Connected.
DECLARE
  l_runid  NUMBER;
BEGIN
  l_runid := DBMS_HPROF.analyze (
               location    => 'PROFILER_REP',
               FILENAME    => 'F_CALCULATE_COMM.TXT',
               run_comment => 'Analyzing the execution of F_CALCULATE_COMM.');
  DBMS_OUTPUT.put_line('l_runid=' || l_runid);
END;
PL/SQL PROCEDURE successfully completed.
Now, the SCOTT user can find the profiler output stored in database tables.
The SQL below queries DBMSHP_RUNS table to get the basic information about the profile analysis which includes the analyzer comment and total execution time.
SELECT * FROM SYS.DBMSHP_RUNS WHERE RUNID = 3
/
     RUNID RUN_TIMESTAMP                  TOTAL_ELAPSED_TIME RUN_COMMENT
---------- ------------------------------ ------------------ ---------------------------------------------
         3 01-NOV-11 11.54.33.359000 PM                27926 Analyzing the execution OF F_CALCULATE_COMM.
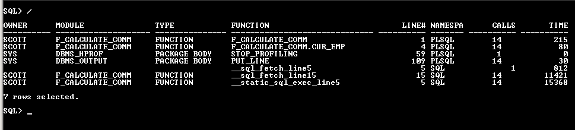
The SQL below queries the DBMSHP_FUNCTION_INFO to get the line by line execution information of the program.
SELECT OWNER,
  MODULE,
  TYPE,
  FUNCTION,
  LINE#,
  NAMESPACE,
  CALLS,
  FUNCTION_ELAPSED_TIME TIME
FROM SYS.DBMSHP_FUNCTION_INFO
WHERE RUNID = 3/
Generating the profiler reports in HTML formats
Now, I shall demonstrate the most distinguishing feature of hierarchical profiler i.e. Generation of HTML reports. This feature is a unique one in itself as it doesn’t requires any UI or development tool to generate the HTML reports. A single command line utility PLSHPROF efficiently scans the raw profiler data and creates the HTML links with proper navigational directions.
The plshprof utility generates the HTML reports for single profiler text file.
Example Syntax [3]
C:Profiler path> plshprof –output [HTML FILE] [RAW PROFILER DATA]
Example Code [1]
Change the directory to the one where raw profiler data has been generated
C:>cd c:profiler
Now run the plshprof utility and specify the output file.
C:profiler>plshprof -output F_CALCULATE_COMM F_CALCULATE_COMM.TXT
PLSHPROF: Oracle DATABASE 11g Enterprise Edition Release 11.2.0.1.0 - Production
[7 symbols processed]
[Report written TO 'F_CALCULATE_COMM.html']
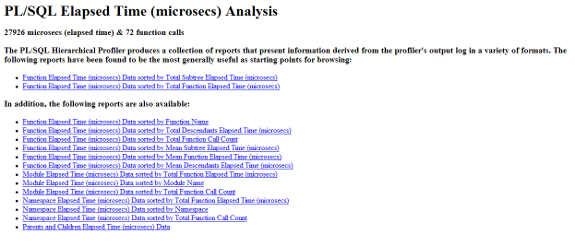
Once the generation of HTML reports has been successfully completed, I can find the 16 HTML files in the same OS location. The file with no suffix after given output name is the main Report Index Interface. It contains the navigational links to all other categories of reports.

Now, I shall open the report index interface as below. Notice the navigational links to all other reports.

The header lists all types of views generated out of the raw profiler data. It contains the summary information and navigational links to all the summary reports.
We shall discuss the important reports.
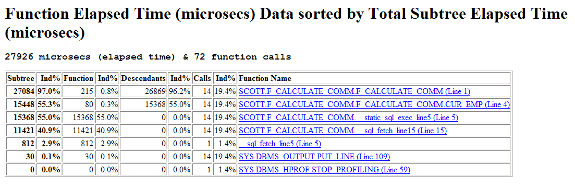
Sample Report 1
Function Elapsed Time (microsecs) Data sorted by Total Subtree Elapsed Time (microsecs)
The report provides the flat view of raw profiler data. It includes total call count, self time, subtree time and descendants of each function.
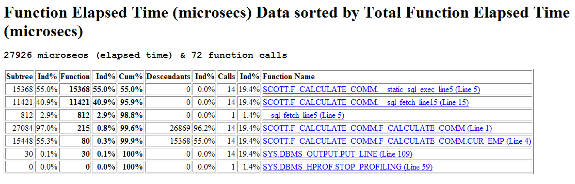
Sample Report 2
Function Elapsed Time (microsecs) Data sorted by Total Function Elapsed Time (microsecs)
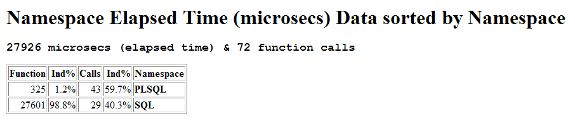
Sample Report 3
Namespace Elapsed Time (microsecs) Data sorted by Namespace
The report provides the distribution of time spent by PL/SQL engine and SQL engine separately. The SQL and PLSQL are the two namespace categories available for a block. It is very useful in reducing the disk I/O and hence enhancing the block performance. The net sum of the distribution is always 100%.
Conclusion
The above two features are essential activity in a product development life cycle. While the profiler is majorly used by developers to observe the server control movement in their program block, the PL/Scope feature is used by the DBA to keep note of the identifiers in the application along with their usage. The hierarchical profiler can perform intelligent analysis and produces self explanatory reports out of a raw output.
[catlist id=185].