Tracing and Debugging a Web Application
In this tutorial you will learn how to trace and debug a web application.- Tracing – Using the TraceContext class, Using Trace and Debug, Trace listeners, Trace Switches and Conditional Compilation.
- Debugging – you will learn setting breakpoints and conditional breakpoints, how to debug a running process and also about debugging a remote process.
Tracing
This class is used to append messages to specific trace categories. For example, if the developer is creating an instance of the System.Web.UI.WebControls.Calendar class for the application, he might include the trace message "Starting To Render" in a rendering procedure, and "Firing OnChange Event" in an event handler procedure. The System.Web.TraceContext class is used to obtain a set of trace records at the end of request execution for custom processing. To enable tracing, set the Trace attribute in the [] directive or the System.Web.TraceContext.IsEnabled property to true. When tracing is enabled, in addition to showing user-provided trace content, the System.Web.UI.Page class automatically includes performance data, control-tree structure information, and state management content for every request.
Using the TraceContext class
The TraceContext Class captures and presents execution details about a web request. This class cannot be inherited. It is available in the System.Web namespace. This object can be declared and instantiated in the following manner.
Dim ctxt As HttpContext
Dim txtxt As New TraceContext(ctxt)
This class can be used to append messages to specific trace categories. If an instance of a calender class is being created for the application, a trace message may be included such as– “Starting to render” in the rendering procedure, and “Firing OnChange Event” in an event handler procedure. In this case the TraceContext class can be used to obtain a set of trace records at the end of request execution for custom processing.
Using Trace and Debug
It is not always possible to use the debugger. In such circumstances tracing becomes a useful alternate. If the pages are hosted on a remote server the debugger may not be available. Tracing also makes it easy for the user see information, such as the HTTP header, that is not explicitly available in the debugger.
The website used for consuming web services may be used again to study the impact of tracing. To the solution add a new item by right-clicking on the project in the solution explorer. In the templates dialog box choose Web Form. In the name box type TraceTestPage.aspx. Now proceed to add one TextBox, one Button and a label.
Now add code to the page. When the page is running without any problem, the user can enter a name and click the button, which displays the name in the label control. If the user closes the browser and then comes back to this page, the page will already have the user’s name, because it is stored in a cookie.
To add code right-click on the name of the page in the solution explorer and click view code. Inside the class definition, you can enter the following code:
Partial Class TraceTestForm_aspx
Inherits System.Web.UI.Page
Sub buttonDisplayName_Click(ByVal sender As Object, _
ByVal e As EventArgs)
Label1.Text = Server.HtmlEncode(TextBox1.Text)
Response.Cookies("username").Value = Label1.Text
End Sub
End Class
The code performs the following tasks:
It reads the value of the TextBox control and displays the name in the Label control. As part of this logic, the code calls the System.Web.HttpServerUtility.HtmlEncode method, which turns potentially executable HTML characters such as < into their display equivalents. This is a security measure to prevent scripting exploits. The code creates a cookie named username that stores the value that the user has entered.
When the application is built and executed, the web page appears. Type a name in the browser and click the submit button. When the post back of the page takes place, the posting takes place. The name is not displayed in the label1.
To enable tracing to be true, do the following:
1. Switch to Default.aspx and switch to Design view.
2. In the drop-down list at the top of the Properties window, select DOCUMENT.
3. This displays properties for the page.
4. Set Trace to true.
The trace setting is actually made as part of the @ Page directive. This can be seen by switching to Source view and looking at the first line in the page. The @ Page will look like this:
Sub buttonDisplayName_Click(ByVal sender As Object, _
ByVal e As EventArgs)
Trace.Warn("debugging", "Start buttonDisplayName Click handler")
Label1.Text = Server.HtmlEncode(TextBox1.Text)
Response.Cookies("username").Value = Label1.Text
Trace.Warn("debugging", "End buttonDisplayName Click handler")
End Sub
The page when executed does not produce the desirable out put. The out put that appears is displayed below with the trace information:
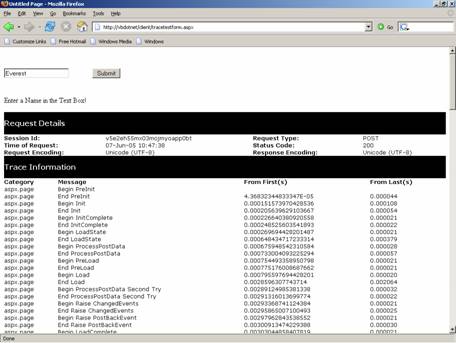
When the trace output is examined, it is clear that the output contains no red text. You can conclude from this that the button’s Click handler is not being called. Now add the following code to the program instead of the code available for the button. The code will look like the following listing:
Click here to view sample code
The output generated looks like the graphic shown below:
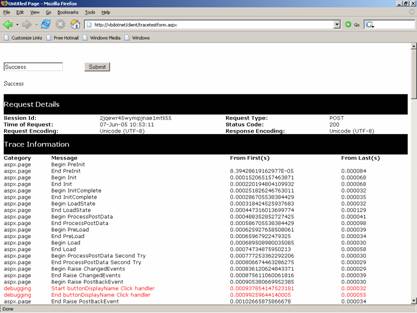
The desired result is achieved. The most common reason that a handler is not called is that the control has not been properly bound to the event handler. That is true in this case — although the event-handling code has been added, the button’s Click event was not bound to the handler. (Normally, Visual Web Developer binds the event to the control when the control is double-clicked in Design view.). Now the corrected the code creates the desired result. The red colored text indicates that that the button’s click handler is called.
{mospagebreak}
.
.
.
.
.
.
Trace Listeners
While using Trace and Debug, it is important to set up a mechanism for collecting and recording the messages that are sent. Trace messages are received by listeners. The purpose of a listener is to collect, store and route tracing messages. Listeners direct the tracing output to a designated target such as a log or a window or a text file.
Three types of predefined listeners are available:
1. A TextWriterTraceListener that redirects the outpur to an instance of TextWriter or to a stream class.
2. An EventLogTraceListener which redirects the output to an event log
3. A DefaultTraceListener which gives out Write and WriteLine messages to the OutputDebugString and to the Debugger.log method.
If the user wants any listener besides the DefaultTraceListener to receive Debug and Trace output, he must add it to the Listeners collection. Examine the following lines of code:
System.Diagnostics.Trace.WriteLine("Error in Widget 42")
System.Diagnostics.Trace.Listeners.Clear()
System.Diagnostics.Trace.Listeners.Add(New System.Diagnostics.TextWriterTraceListener(Console.Out))
If Not Request.Cookies("username") Is Nothing Then
The first part is used to add a listener object to a Trace.Listeners collection in the application. The second part is used to make the listener to send tracing information t a console.
Trace Switches
Trace switches helps enable, disable and filter tracing output. These objects are existing in the code and also can be configured externally through the .config file. The .NET infrastructure provides two types of switches namely, BooleanSwitch class and TraceSwitch Class. The BooleanSwitch acts as a toggle switch, either enabling or disabling a variety of trace statements and the TraceSwitch Class allows you to enable a trace switch for a particular tracing level so that the trace message specified for that level and all the levels below it appear. If this switch is disabled, the trace messages will not appear.
Trace switches are useful in filtering information. For instance is the user wants only error messages in the application displayed. By using the .config file to configured with the appropriate settings we can control the types of messages that are received.
The developer needs to create a switch object from a BooleanSwitch class or TraceSwitch Class or he may use a developer defined switch.
A TraceSwitch object has four properties that return Boolean values indicating whether the switch is set at a particular level as given below:
1. TraceSwitch.TraceError Property
2. TraceSwitch.TraceWarning Property
3. TraceSwitch.TraceInfo Property
4. TraceSwitch.TraceVerbose Property
The appropriate levels can be set as per need using the properties as under:
|
Enumerated value |
Integer value |
Type of message displayed |
|
Off |
0 |
None |
|
Error |
1 |
Only error messages |
|
Warning |
2 |
Warning messages and error messages |
|
Info |
3 |
Informational messages, warning messages, and error messages |
|
Verbose |
4 |
Verbose messages, informational messages, warning messages, and error messages |
The following lines of code are used to create a switch object and use it to filter trace output:
Dim myTraceSwitch As New System.Diagnostics.TraceSwitch("SwitchOne", "The first switch")myTraceSwitch.Level = System.Diagnostics.TraceLevel.Error
‘ This message box displays true, becuase setting the level to
‘ TraceLevel.Info sets all lower levels to true as well.
MessageBox.show(myTraceSwitch.TraceWarning.ToString())
‘ This messagebox displays false.
MessageBox.Show(myTraceSwitch.TraceVerbose.ToString())
Conditional Compilation
While developing applications in .NET, the user can select any specific sections of the code to compile while excluding the other sections. Conditional compilation statements are designed to run during compile time and not at run time.
#Const directive is used to declare a conditional compiler constant. The user can typically assign any particular block of code to be compiled by using #IF … Then #Else directive. Let us assume that we are writing debugging statements that check the performance of order processing in a eCommerce solution and is to be used to process data of multiple types of customers who pay using credit card, direct account debit and by cheque. The Conditional compiler code will be like the following:
#If CreditCard Then
…..the code for credit card holders
#Elseif AccoutDebit Then
….the code for AccountDebit
#Else
….the code for other options
#End If
The value of the Credit Card can set a constant to true at compile time to compile the code written for that.
The predefined constants available for conditional compilation are given below:
Constant CONFIG A string that corresponds to the current setting of the Active Solution Configuration box in the Configuration Manager. DEBUG A Boolean value that can be set in the Project Properties dialog box. TARGET A string representing the output type for the project or the setting of the command-line /target option. The possible values of TARGET are: "winexe" for a Windows application, "exe" for a console application, "library" for a class library, and "module" for a module. The /target option may be set in the Visual Studio integrated development environment TRACE A Boolean value that can be set in the Project Properties dialog box. By default, all configurations for a project define TRACE. VBC_VER A number representing the Visual Basic version, in major.minor format. The version number for Visual Basic
Description
.
.
.
Debugging
Setting breakpoints and conditional breakpoints
While we have a facility to step through the program, it is not an easy task to do so. Setting a breakpoint at strategic location in the code is useful as the program runs normally till that point is reached. The program can be checked at execution time at the breakpoint. Then the user can press F5 to continue or step through the code by pressing F10 or F11. To insert a break point the user has to place the cursor on the line of the code where he wants to break the execution and press F9. Alternatively the user can also click on the margin to the left of you code. A breakpoint symbol is displayed on that line.
A breakpoint can be removed by placing the cursor on the line with break point and press F9 again or click on the breakpoint symbol to clear that break point. The context menu can also be used for this purpose.
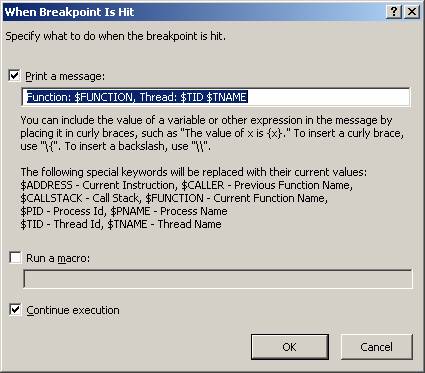
If several break points have been set, the user can choose to remove all the break points by clearing all breakpoints by choosing the Clear All Breakpoints in the Debug menu. All breakpoints can be enabled or disabled by choosing the appropriate option. Breakpoints can also be created by choosing the new breakpoint option from the debug menu. A dialog box is presented with a dialog box like the screenshot shown below.
If the execution is to be broken based on the value of a variable, then a conditional Breakpoint can be added. Right-clicking on the breakpoint opens a condition dialog box. See screenshot below.
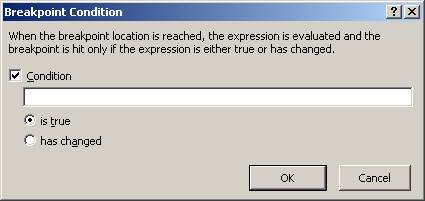
The Condition is an expression that determines whether the breakpoint is hit or skipped. When the debugger reaches the breakpoint, it will evaluate the condition. The breakpoint will be hit only if the condition is satisfied. You can use a condition with a location breakpoint to stop at a specified location only when a certain condition is true. If the application that is being debugged is a banking application, where the account balance is never allowed to go below zero, then it must be ensured that the value for the variable account balance is always greater than zero. The breakpoints may be set at certain locations in the code and condition attached like balance < 0 to each one. When the program is run, execution will break at those points only when the balance is less than zero. The variables and program state can be examined at the first breakpoint location, then continue execution to the second breakpoint location, and so on.
Debugging a running process
A running process can be debugged by first attaching to. Choose the option Attach to Process from the Debug menu to attach a process. In case no project is open, a process can be attached by choosing Attach to Process from the Tools menu. This action opens the Attach to Process dialog box to open. In the dialog box choose the program that has to be attached from the available processes list. After choosing this process then click on the attach button.
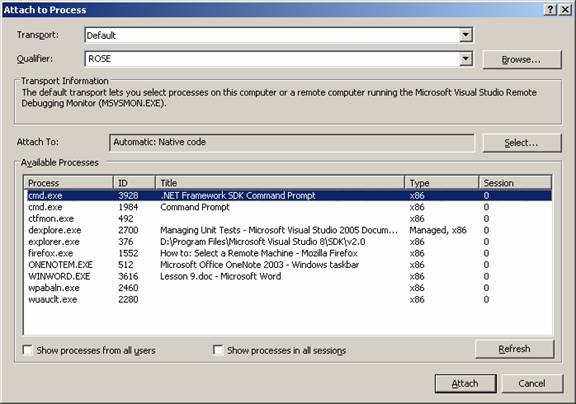
The list of available processes is displayed automatically when the processes dialog box is opened. Process can start and stop in the background while the dialog box is open. Because of this the contents may not be current and the user will have to be refresh the list from time to time, by clicking the refresh button.
It is also possible for the user to be attached to multiple programs simultaneously when debugging, but only one program is active in the debugger at any given time. The active program can be set in the debug location toolbar. All the debug commands affect the current program only.
The debug windows option can be clicked in Debug menu to select the processes window. In this processes window double click the process that has to be made active.
Debugging a remote process
A remote process can be attached in the same way as a user can attach to a local process. In order to attach a remote process, go to the Attach to Process dialog box as in the earlier case. Check on the transport check box to ensure that proper transport is selected. In the name box type the name of the remote machine or select the machine name from the drop down list. Click on the ellipse button next to the name list to open the Browse for Computer. In the browse for computer dialog box, use the name of the list to open the machine. Click OK to connect to the process in the remote machine.
In this lesson we have dealt in some detail the procedure involved in testing and debugging applications. In the next lesson we shall be examining how to work with legacy code.
[catlist id=175].